
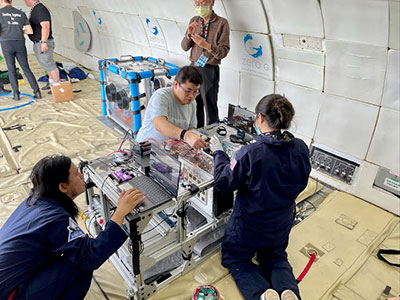
Experiments in Zero Gravity with Dan Burns and the Zero-G Company
As part of our partnership with the Zero-G company, we sent our favorite aerospace engineer, Dan Burns, to test physics experiments aboard the G-Force One plane.
A Lifetime of Space Science
I have always been fascinated by the space program. Growing up during the 1960s space race, I remember Mrs. Williamson taking my kindergarten class upstairs to watch the Gemini launches. I admired the astronauts and followed their missions closely, but it was the people who built their spacecraft that inspired me to pursue a career in aerospace engineering. The astronauts often acknowledged that the engineers and technicians were the true space explorers, so I wanted to be one of them.
I joined their ranks in 1982 when I became an engineer at Lockheed Missiles and Space Company (now Lockheed Martin Space). There I worked on various spacecraft for NASA and the Department of Defense – some of which will orbit the Earth for thousands of years.
As much as I loved exploring space as an engineer, I’d always dreamed of traveling to space one day. Those who are fortunate enough to visit space enjoy two incredible experiences: The first is seeing the planet Earth from afar, and the other is experiencing what’s been called zero gravity, zero-g, weightlessness, or microgravity. Among the many names for this experience, the term “free fall” describes it best. Free fall is the motion of an object acted on only by gravitational forces.
Zero-g Flight Opportunity
Free fall is frequently misunderstood, and I put a lot of effort into helping my students understand it during my physics teaching career (I discuss teaching free fall here). Every year, I’d ask students if they’d like to fly on NASA’s KC-135 to experience free fall and be met with a classroom full of hands. I’d explain that many people shared their enthusiasm; some of them would even pay money to realize their dream of floating like the astronauts. I encouraged my students to take advantage of this market by starting a business, but alas none ever did.
While I was busy planting seeds for my future student-sponsored trip, a group of enterprising individuals started the Zero-G company. I considered applying to the teacher flight program, but they were seeking middle school teachers at the time. Then the teacher program ended. If I wanted to fly, I’d have to purchase my own ticket.
Time went by, and I retired from teaching physics, eventually bringing my dream of experiencing free fall to PASCO. Then, last year, something surprising happened. Zero-G's, Deb Houts, reached out to PASCO looking to collaborate. As coincidence would have it, Zero-G was planning to revive their teacher flight program, and they wanted PASCO’s help updating their activities and experiments. I enthusiastically began working on the project, which included fulfilling Deb’s request to fly a Kundt’s tube on Zero-G’s 727-200.
About Deb Houts
A retired physics teacher, Deb first flew with Zero-G in the teacher flight program, then later as a flight director. During her time in the teacher flight program, it became clear she has an amazing ability to tolerate parabolic flight without any ill effects. In fact, Deb seems to thrive under such conditions and has been flying with Zero-G for 10 years.
What’s a Kundt’s Tube?
A Kundt's tube (pronounced “koonts tube”) is a clear cylinder with a variety of lengths and diameters. It is sealed at one end with a single frequency sound source at the other end. The inside of the tube contains a fine powder or particles, which form a standing wave pattern when the frequency of the sound resonates through the tube.
What is a Kundt’s Tube Used For?
The powder in a Kundt’s tube is most disturbed at the anti-nodes and least disturbed at the nodes. The fundamental frequency of the tube has a wavelength that is twice the length of the tube. Though modern Kundt’s tubes use a speaker and frequency generator to produce sound, Kundt’s original tube used a vibrating rod. Kundt used his tube to determine the frequency of the vibrating rod, so he could determine the speed of sound in the metal. Today, Kundt’s tubes are primarily used for classroom demonstrations and physics lab activities.
Designing a Kundt’s Tube for Zero-G Research
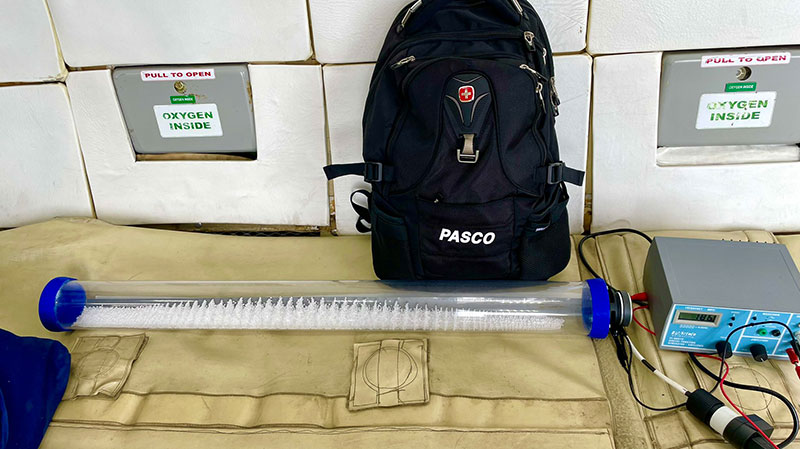
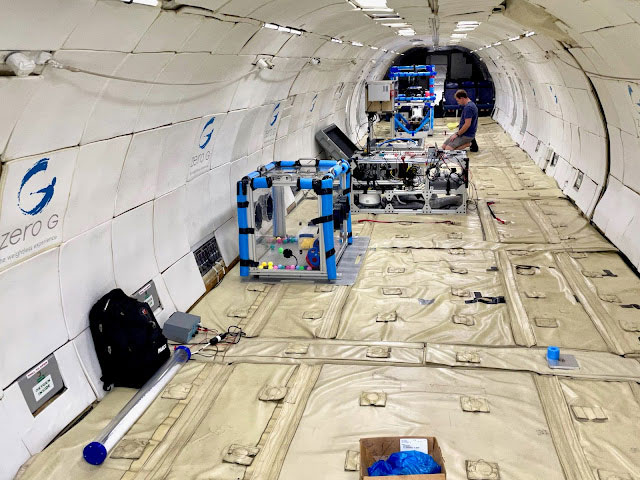
Deb was curious to know what the standing wave pattern would look like in free fall, so I started experimenting with different tubes. One commonly used tube is the clear cover used to store fluorescent light bulbs. They are inexpensive, but they’re also too flimsy for the Zero-G plane. Mounted experiments must be able to withstand high accelerations. Deb also wanted the Kundt’s tube to have a larger diameter, so it could be more easily seen. I found a 3.5" diameter, 0.92-m-long acrylic tube in our spare stock room and decided to use that.
I knew the duct tape I used to seal the end and attach the speaker wouldn’t survive high acceleration, so I asked PASCO's resident engineering wizard, Jon Hanks, for help. A few hours later, I had a 3D-printed end cap and a PASCO-blue speaker mount that worked perfectly.
|
Now I had to find a suitable powder to use. Deb suggested Styrofoam beads because they are easy to see. I also saw Kundt's tubes online that used them, so I figured I’d start there. I quickly encountered a new problem: static electricity. When I tried 0.01" diameter Styrofoam beads, they would levitate and zip around as I opened the bag, defying gravity without the Zero-G plane. They also stuck to the inside of the tube, making the standing wave pattern harder to see. I tried different sizes and cork dust with no luck. Nothing was working, so I did what any great physicist would do: I ordered some anti-static spray. It worked! |
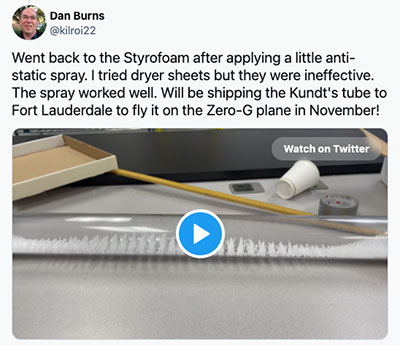 |
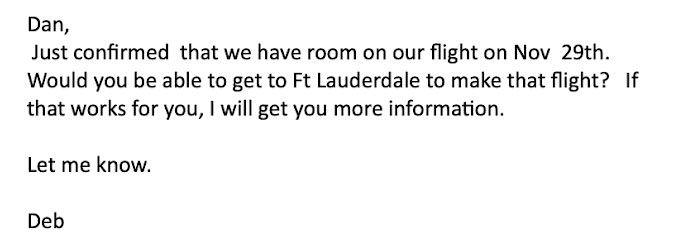
I made a few videos and sent Deb a report of the results. After getting the go-ahead to ship the Kundt’s Tube to Ft. Lauderdale, I received this email.
Whoo-hoo! My time to fly on a Zero-G plane had finally arrived. With my spot secured, it was time to focus on the science. I had less than two months to prepare experiments before my flight on November 19, so I turned to my colleagues and classroom free fall experiments.
Zero-g Experiment 2: Apparent Weightlessness
One of my favorite demonstrations comes from the Conceptual Physics Lab Manual, which happens to be authored by my friend, Paul Robinson. I used it in my classroom for many years because it’s simple, effective, and students love it.
Start by poking two holes in the side of a cup near the bottom. Fill it with water and hold it over a container, keeping the holes covered with your fingers. Ask students what will happen if you remove your fingers. After some discussion, lift your fingers and the water will stream out. Now ask what would happen if you carefully filled the cup on the International Space Station and removed your fingers. Many students know the answer but can’t verify their predictions. Ask how they can verify their thinking for themselves. If you’ve discussed how orbiting is the same as free fall, they will suggest dropping it. Tell them you won't drop it, but they can.
Tips for the Apparent Weightless Activity
Doing this activity as a demo can backfire, as the cup will fall with the water that previously came out. Additionally, students in the back of the room may not notice that the water stops coming out. Dropping the cup yourself makes it much easier to observe the water stopping, so it’s best if students have their own cups to drop. If you’re preparing the cups ahead of time, I suggest using a drill to do 4 to 5 at a time.
Student Activity
Grab a couple of buckets filled with water and take the class outside to test their cups. My campus was hilly and made finding a spot to drop them easy. Even if your campus is flat, it is worth dropping them from just above your head. Students won't complain about getting their feet wet. Once they see what happens when they hit the ground, even the shyest student will get a cup to try it themselves. Over the years, I had many students say this was their favorite activity on my year-end survey. I highly recommend trying it with your class. Check out this teacher guide video to see the activity in action. Fast forward to 5:50 for some cool slo-mo.
Tailoring the Activity for Free Fall
The weightless cup activity was a must, but I had to figure out how to do it on the Zero-G plane without spilling too much water. Funnily enough, this would be harder than doing the activity on the ISS due to the changes in acceleration and pressure. Eventually, I came up with the idea of using a PASCO water bottle with a valve on the top. I drilled holes and covered them with tape. During free fall, I would equalize the pressure with the valve, remove the tape, and open the valve to see if the water came out. There would be no need to let go, as it would already be falling with me.
Zero-G Experiment 3: Wireless Acceleration/Altimeter
| The PASCO Wireless Acceleration/Altimeter has given me great results on amusement park rides in the past, so it seemed only natural to bring it with me on the Zero-G flight. The device has a 3-axis accelerometer and altimeter, and it measures angular velocity about 3 axes. The lowest acceleration range is ±16g, with an accuracy of ±0.04g. The ±100g, ±200g and ±400g ranges are accurate to ±1g. I decided the low g range would work best for the flight. The altimeter won’t measure altitude accurately in a pressurized jet, but measurements of the cabin pressure while the air is accelerated by flying parabolas should be interesting. | 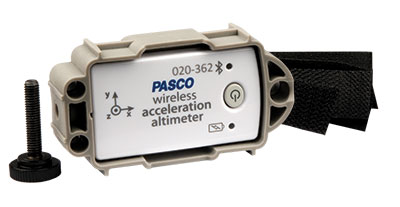 |
The Wireless Acceleration/Altimeter is perfect for teachers who want to collect measurements for launched objects, without the risk of damaging equipment. It is encased in durable housing that allows students to throw it as high as they can to measure their own parabolic flights. It can be attached to carts and rotating platforms using the included thumbscrew or Velcro strap, and it has a remote logging feature, like most PASCO Wireless Sensors. With Logging Mode, you can configure the sensor while connected to a computer, disconnect it, and start collecting data whenever you’re ready. This feature allows the sensor to be used beyond Bluetooth range for student experiments, like launching it up with a slingshot. It also makes it perfect for Zero-G flights, because you don't need to bring a computer or smartphone.
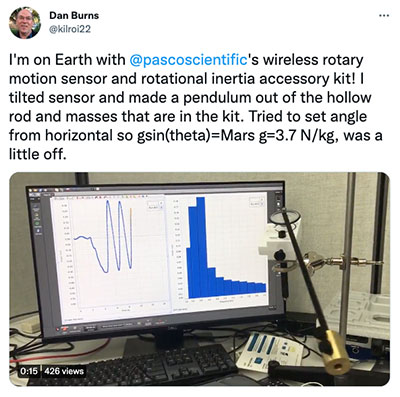
Zero-G Experiment 4: Pendulum
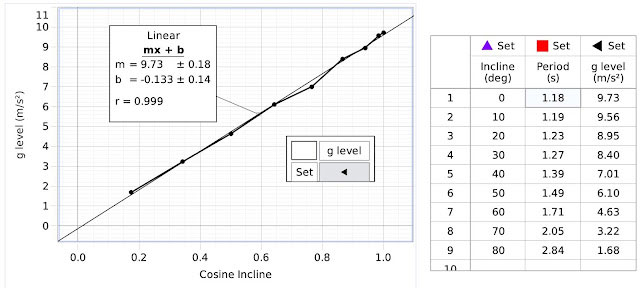
For my fourth experiment, I decided to study a pendulum using PASCO's Wireless Rotary Motion Sensor. The pendulum is easily constructed from the rod and masses that come with the Pendulum Accessory, and I could use the Rotary Sensor to measure the position and velocity of the pendulum versus time. Using the rigid rod instead of a string keeps the pendulum from swinging out of the plane. The data can be used to find the period during the Martian and lunar parabolas, as well as the high-g experienced when the plane pulls up. In free fall, it will not oscillate but will rotate in a circle with a period that’s determined by how hard you push it.
Of course, there might be some surprises about its behavior in free fall. Check out this video of Tony Fleury's pendulum experiment from his teacher flight with Zero-G, back in 2009. If you use it in class, you can ask students to use a stopwatch to measure the periods of the pendulum and spring/mass set in the video. In the video, the acceleration is measured using a legacy PASCO PASPort Accelerometer and displayed in m/s2 on a PASCO Spark Science Learning System.
Countdown to Zero-G Flight: 2 Days
I received tons of experiment ideas from colleagues, but the Zero-G flight has limited room. Luckily, this is just the beginning of our work with the Zero-G company, and these ideas will likely come to fruition. With the experiments settled, it was time to hit the road. On 11/17/21 I boarded my flight to Ft. Lauderdale. It took all day, but it was good to fly again. I received my third Pfizer COVID vaccine shot 3 weeks before, so I felt safe on the crowded flights.
Countdown to Zero-G Flight: 1 Day
The next day, I met with Deb Houts to discuss experiments, plan the teacher flight program, and walk-through G-Force One. That’s when I learned that Friday's flight would be different than a normal Zero-G flight. There would be academic and commercial research experiments onboard, which meant that instead of flying the usual 15 parabolas, we were going to fly 30! I had prepared myself for 15 and was confident I would not have much motion sickness. Now I wasn’t so sure. On one hand, I’d have more time to conduct my experiments and enjoy the experience of floating. On the other, this also meant I’d have more time to experience motion sickness.
|
In addition to the researchers, there would be 11 intrepid adventurers who signed up for Zero-G's new Astronaut Experience Program (AE). For them, the main attraction was the 30-parabola flight. At $10,500 it’s only $2,300 more than the 15-parabola flight, a savings of almost $200 per parabola! Deb approved all my experiments, except for the pendulum. Each experiment needs to be mounted to the side of the plane, undergo a high-g test, and be finalized in paperwork. Our goal is to have the process finished by the time teachers start flying. She also said any PASCO sensor must be checked for electronic interference. The Wireless Acceleration/Altimeter was given a pass because it could be used in remote Logging Mode.
|
|
The walk-through of the plane was very exciting. The researchers were configuring their experiments and the Zero-G personnel were getting the plane ready. It had flown in the morning for the 4th time that week. Boeing was conducting missile tests in the Gulf of Mexico, requiring the Zero-G flights to take off at 7:00 AM. I needed to be at the executive jet terminal at 5:30 AM the next day. I was still on West Coast time, so I decided to go to bed early.
Countdown to Zero-G Flight: <3 Hours
After meeting in the executive jet lobby, Zero-G shuttled the AE participants to the hangar. We got into our jumpsuits, received a preflight briefing, and were supposed to have a breakfast of bagels and juice. Unfortunately, the delivery person got stuck in traffic. This was the first of several bagel-related incidents that would occur that morning.
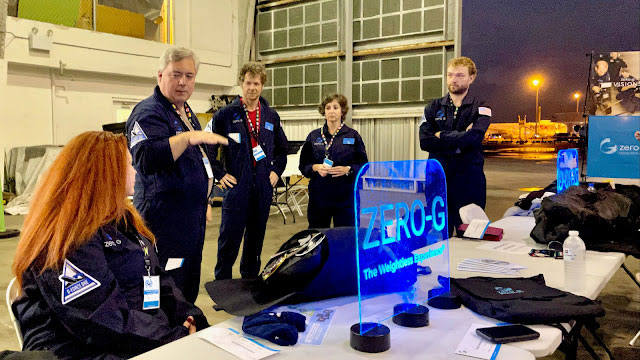
The preflight briefing was given by our flight coach, Dr. C. Marsh Cuttino. Marsh works part-time for Zero-G and conducts medical space research with his company, Orbital Medicine. Marsh has flown many Zero-G and NASA parabolic flights, so we listened attentively.
Welcome Aboard G-Force One
Once aboard G-Force One, I noticed the forty-four seats in the back full of AE participants, researchers, and Zero-G personnel. Fellow former physics teacher, Deb Houts, was serving as our Flight Director (and I thought I had a great post-teaching job). Shortly before takeoff, the bagels and juice finally arrived. I grabbed what I thought was a cheese bagel, but it turned out to be cinnamon. That would haunt me later.
Our flight path took us over the Gulf of Mexico. The plane would do five parabolas, turn around, do five more and repeat until we reached 30. Here is an animation of the flight path from Flight Tracker. In addition to location data, Flight Tracker also posts direction, speed, altitude, and climb rate data for flights, which can be handy for activities involving real-world physics.
The AE participants were led to the front of the plane just before reaching the starting point for parabolic flight. The flight was a little cramped, mostly due to a new green screen that’d been taped to the front bulkhead and draped around the sides. Space was further limited by a restriction that prevented us from going near the research experiments. In theory, this sounds like a simple, logical rule, but it’s hard to keep yourself from colliding with experiments when you’re floating for the first time!
Martian Gravity
For the first parabola, they flew the plane with a downward acceleration of about 6.1 m/s2. All of us on the plane are still pulled to the floor by the Earth's gravitational force. However, the normal force is less than mg because they are accelerating. A quick free body diagram of a passenger (with up as positive) gives N - mg = ma. Using a = -6.1 m/s2 and g = 9.8 m/s2, N = m*(9.8 N/kg - 6.1 m/s2) = m*(3.7m/s2). The normal force is equal to what it would be for the passenger if they were at rest on the surface of Mars, where g = 3.72 N/kg.
Lunar Gravity Parabolas
They flew one more Martian gravity parabola followed by two lunar gravity parabolas. The gravitational field strength on the surface of the Moon is 1.62 N/kg. This means the plane had to fly with a downward acceleration of about 8.2 m/s2. The reduced gravity parabolas help passengers physically adjust before going zero-g. The 15 parabola flights only have one Martian and lunar parabola. I alternated between taking a video of the Kundt's tube (more on this later) and hopping around. Some passengers did 1-arm pushups and other feats of strength. The lunar gravity was especially fun, and I envy the future tourists who will travel to the Moon.
Between parabolas, the plane causes an upward acceleration to reduce and change the direction of the downward vertical velocity. This upward acceleration is about 7.8 m/s2. This creates a normal force about 1.8 times what the passenger would feel if they were at rest on the surface of the Earth.
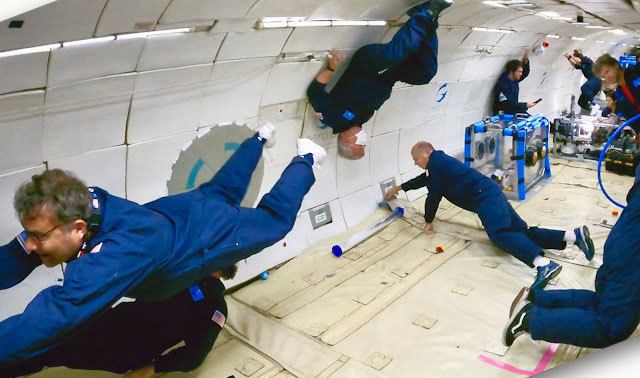
The Free Fall Experience
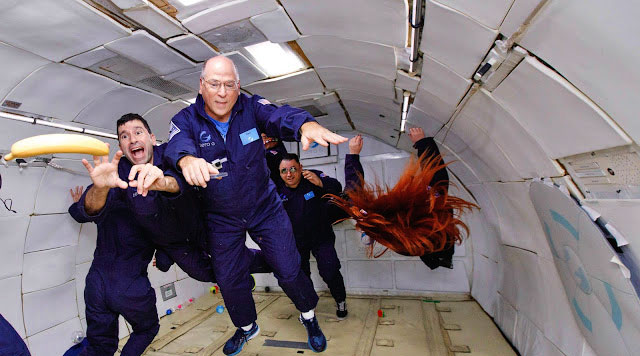
On our fifth parabola, the plane caused a downward acceleration of 9.8 m/s2. A free-body diagram shows the normal force is equal to zero. Normalforcelessness at last! It is amazing to feel the transition. One moment, you’re laying on the floor accelerating upward at 7.8 m/s2, and the next, you’re accelerating downward at 9.8 m/s2. As this change was ending, I could feel myself slowly rise out of the padding. A slight push sent me floating toward the ceiling. Is this still the ceiling? There is no up or down now. I had spent my whole life feeling the gradient of normal force, which feels equal to my weight at my feet and decreases to zero near the top of my head. That gradient is gone in free fall. There is only a gravitational force acting on me, and it’s pulling equally on every neutron and proton in my body, so it cannot be felt.
Experiences in free fall come with strange surprises. For instance, I learned that I was accustomed to where my internal organs hang in my abdominal cavity. In free fall, they shifted toward my neck and stayed there. My heart continued to pump blood as if it were working against gravity, causing my head to look and feel puffy.
After about 22 seconds, this ends and you are pressed to the floor, feeling much heavier than normal. The transitions on our flight were more abrupt than usual to extend free fall for the experiments. If you were unprepared, you could find yourself falling more than a few feet and/or landing on someone. To prevent illness, everyone aboard had been vaccinated or had recently tested negative for COVID. We were required to wear masks and were advised to take them off if we felt even mildly nauseous. Most participants had their masks off after a few parabolas.
Kundt’s Tube in Zero-G
It was a distracting work environment, to say the least. The Kundt’s tube was attached to the floor with Velcro, and I wedged the frequency generator between the padding. It stayed in place but took some damage from people kicking and landing on it, which caused the wires to come out of the speaker. Reattaching them would sometimes send me floating toward the ceiling, unable to adjust the frequency or take video. Deb and I decided that the Kundt's tube should be mounted to the wall in future flights, so it’s easier to see and reach. This will also prevent people from colliding with the Kundt’s Tube when the plane pulls up.
Zero-g Experimental Results: Kundt’s Tube
The results from the Kundt's tube experiment were fascinating. Below is what it looks like in 1g at the PASCO office building. The video first shows it resonating at the fundamental frequency and then at the first overtone of the 0.92-m-long tube. Students can measure the wavelength of the standing wave using the tube dimensions and the fact that there’s a node at each end. Multiply the wavelength by the frequency to find the speed of sound in the tube.
Interpreting Kundt’s Tube Patterns
Notice the other patterns in the tube. The Styrofoam pellets form walls in the wave pattern. They are tallest at the anti-node. It was Deb’s curiosity about what would happen to these walls in reduced gravity and free fall that inspired her to fly a Kundt's tube. The cause of these structures is not easy to explain, even Kundt couldn't. The best explanation I found was from a 1932 paper titled, "On the Groupings and General Behavior of Solid Particles Under the Influence of Air Vibrations in Tubes," by Edward Andrade. I recommend reading the summary and inspecting the pictures at the end. You can download a pdf of the paper here.
If papers aren’t your style, then the short answer is that vortices form around spheres in a vibrating fluid. The vortices act to repel other spheres, but they also cause an attraction if they get very close. The spheres forming walls are close enough to feel the attraction, but they repel the spheres in the adjacent walls. Additionally, there are small air currents flowing longitudinally in the Kundt's tube. These distribute the spheres along the tube and cause some spheres to change walls. You can see these phenomena in the closeup slo-mo video below.
Deb’s main question asked, "What will the walls look like in reduced gravity and free fall?" An obvious guess was that they will become taller because the disturbing forces from the wave interference will lift them higher. This guess was confirmed by their appearance during the Martian gravity parabolas. I wish I would have marked the tube for comparison height measurements, but they certainly look taller.
The walls were even higher during the Lunar gravity parabola, with some of the spheres bouncing off the top of the tube.
I was very curious to see what would happen in free fall. I suspected they would get even taller and be symmetrical. The walls might fill the tube as a thin cylinder. That is what happened, but I was still surprised by what I saw.
The Styrofoam spheres were forming cylinders, but they formed near the nodes. In 1 g and reduced g trials, the standing wave pattern remained with little activity near the nodes. The walls were always tallest at the anti-node. What was going on? At the anti-node, the disturbance from the wave interference was enough to disrupt wall formation. Perhaps gravity is needed to keep the spheres close enough so that the attractive force is a factor. Without it, the disruption from the wave interference can keep them apart. Resonance was also indicated by the formation of cylinders near the nodes and the increase in sound volume. The small amount of disturbance near the nodes was enough to form the cylindrical walls, but not enough to immediately disrupt them. This is certainly not Nobel-prize worthy, but it was exhilarating to discover something that has never been observed before. Unfortunately, I don't have more video with wide-angle shots, slo-mo, and higher resonant frequencies.
Speed of Sound in Zero-G
The Kundt's tube experiment yielded an interesting result for the speed of sound. The fundamental frequency was measured at 177 Hz. The wavelength is twice the tube length or 1.84 m. This gives a speed of sound equal to 177 Hz x 1.84 m = 326 m/s.
What is interesting about that? The fundamental frequency measured at PASCO was 186 Hz. This gave a speed of sound of 342 m/s. Why the difference? I first thought it was the lower cabin pressure. Planes typically are pressurized to the equivalent of about 8000 ft. My college chemistry teacher would have been disappointed by my hypothesis because I am sure I learned that the speed of sound does not vary with pressure. It seems like it should because at zero pressure there is no speed of sound. Shouldn't it gradually get slower as the pressure is reduced? The answer is that the speed of sound gets smaller as pressure is reduced, but it increases as density is reduced. These two factors cancel out. The difference was due to a difference in temperature. We can estimate the temperature from the speed of sound. The equation below solves for the speed of sound in air at a given temperature.
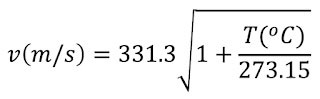
Given v = 326 m/s, solving for T yields 8.7°C (48°F). It was chilly on the plane, but our jumpsuits were warm, and we were too exhilarated to notice. If we add a temperature measurement for comparison, students could calculate the cabin temperature using their teacher's onboard measurements with the Kundt's tube.
Zero-G Research Results: Apparent Weightlessness
The bottle of water worked as expected. I equalized the pressure with the valve and removed the tape over the holes. A few drops came out as I took the tape off, but quickly stopped. I noticed the water sloshing in the half-filled bottle. It reminded me of a problem we had when I worked as an aerospace engineer. The rocket propellant on an orbiting satellite sloshes similarly to the water in the water bottle, making it difficult to extract for a rocket thrust. There are several methods used to control sloshing, from spinning the satellite to accelerating it with compressed gas thrusters.
It was fascinating to observe this phenomenon firsthand. The close-up shots of the bottle are from the GoPro camera I Velcroed to my chest. The GoPro worked great when I tested it in my hotel room, but I was disappointed by the quality of my footage after the flight. In the hotel room, gravity pulled on the camera keeping it stable. In free fall, it tilted up and down from the slightest jostling. Most of the GoPro footage proved unwatchable. I will mount it to the cabin wall in future flights, so I can film experiments hands-free. Here's an unrelated (and very cool) video of participants trying to catch water in zero-g.
Zero-G Research Results: Wireless Acceleration/Altimeter
As I anxiously downloaded my logged flight data from the Wireless Acceleration/Altimeter, I braced myself for surprising results. Opening the file, I found all my data as it should be, a relief given my struggle with the Kundt’s tube!
When setting up Logging Mode, PASCO's SPARKvue software gives you an estimate of how long it can collect data based on the sample rate, the number of sensors activated and the sensor's internal memory. To maximize the sensor’s battery, I turned off the gyro and lowered the sample rate to 5 Hz. This gave me one hour, which was enough time to measure most of the parabolas. Next time I will keep the gyro on to measure the pitch rate of the plane during a parabola.
I activated the Acceleration/Altimeter after the first Martian parabola. It collected data for almost an hour, stopping during the twenty-sixth parabola. Below is the acceleration graph showing the resultant acceleration in m/s2 on the vertical axis and time in seconds on the horizontal axis.
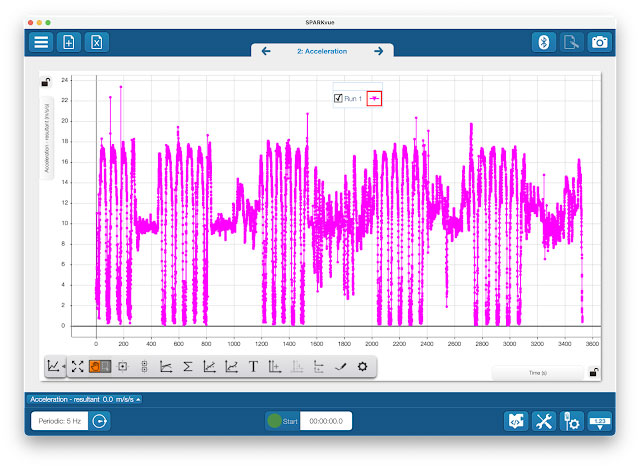
Because I had the sensor in my pocket or floating in the cabin, I graphed the resultant acceleration. It is the vector sum of all 3 directions but is predominately from the vertical direction. There is some acceleration in other directions caused by the plane, my motion, and the accelerometer colliding with things. On future flights, I will mount it to the wall.
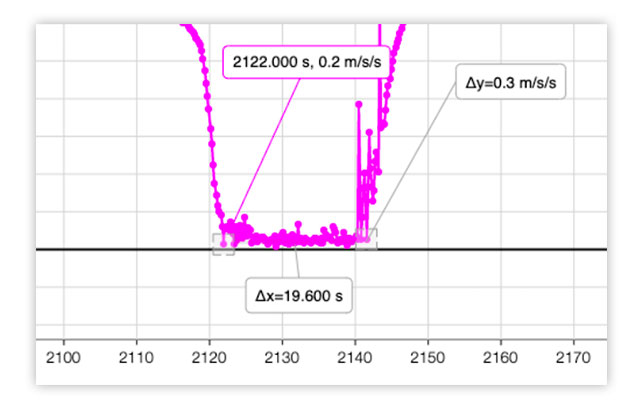
When the graph is at or near zero, the plane is in Martian gravity, lunar gravity, or free fall. The free fall parabolas occur after the first 3. I measured the duration of a few and found them to be about 20 s each. The screenshot below shows a free fall with a steady reading. I used SPARKvue's Delta Tool to measure a duration of 19.6 s.
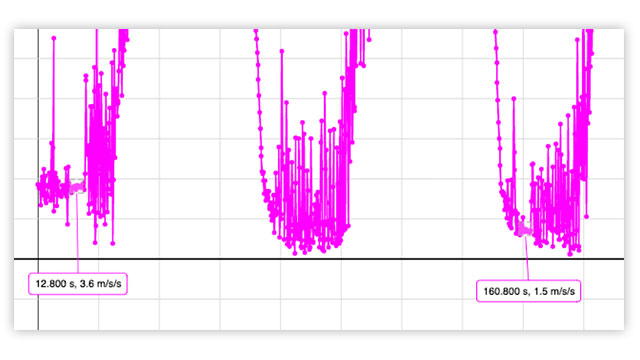
The highest readings occur when the plane is accelerating upward to change the direction of the vertical velocity. These peak at about 18 m/s2 or 1.8 g. We were advised to lay on our backs between free falls and focus on a spot on the ceiling to avoid nausea. I tried to do this every time. Meanwhile, the seemingly impervious Zero-G staff walked around during the high g parts, getting ready for the next parabola. I glanced around to see what they were doing but quickly found this to be a bad idea. Some of the AE participants sat up and even stood during the high g parts. The worst part for me was when the plane turned around after every 5 parabolas. On the graph, these turnarounds appear as an acceleration of 10 m/s2. It was very turbulent, as shown by the graph, especially the long one in the middle.
During the reduced gravity parabolas, the acceleration values are not steady because I was jumping around and taking video of the Kundt's tube. In the parts of the graph with little movement, the acceleration values are reasonably close to the expected values of 3.7 m/s2 and 1.6 m/s2. You can download the SPARKvue data file by clicking this link. If you’re not a SPARKve user, but you’d like to see some cool data, you can always download a free trial of SPARKvue from our website.
Zero-G Altimeter Results
The altimeter data was also interesting. Below is a segment of altimeter measurements shown below the acceleration measurements for several free fall parabolas. The altitude (m) is graphed on the vertical axis with time (s) on the horizontal.
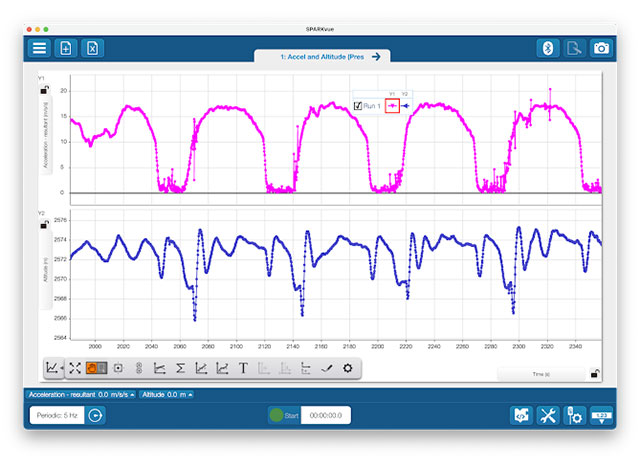
The altimeter graph is zoomed in because the plane's pressurization system kept pressure constant in the cabin. The average was 2573 m or 8442 ft. The variations in cabin pressure resulted in changes to the altimeter reading of about ±5 m. Put simply, the vertical axis shows pressure changes with some very interesting trends.
The pressure begins dropping at the start of each free-fall, drops steeply, then slightly increases before rapidly dropping again as the plane starts to pull up. The overall drop can be explained by the fact that the air in the cabin is not accelerating relative to the inside of the plane. Without the walls, floor, or ceiling pushing on it, the pressure drops. I am not sure what causes the different drop rates, but it might have something to do with the pressure system adjusting to the increasing outside pressure as the plane loses altitude. The slight increase could be caused by me dropping to the floor at the end of free fall. The highest pressure corresponds to when the plane has a large upward acceleration. During these periods, the floor of the plane pushes up on the cabin air and compresses it. There should be a gradient of pressure from the floor to the ceiling during the high g part. In the future, I will place Wireless Acceleration/Altimeters on the floor and ceiling to see if this gradient can be measured. There is a pressure drop followed by a rise before each free fall and a pressure drop at the start of each high-g part. My guess is the pressurization control system causes these changes, but I need to do a bit more research on plane pressurization systems before I can confirm it.
Finding the Vertical Velocity of G-Force One
PASCO's SPARKvue software has an analysis tool that integrates the acceleration data to find the vertical velocity of the plane. I normalized the values by subtracting 9.81 m/s2 from the data. There was a small drift that had to be subtracted too. I took one section of a parabola and set the initial vertical velocity to zero and produced the graph below. If you want to see the details of these calculations, they are in the SPARKvue file I linked to above. The graph shows the vertical velocity graph below the acceleration graph. Vertical velocity in m/s is on the vertical axis and time in seconds on the horizontal axis.
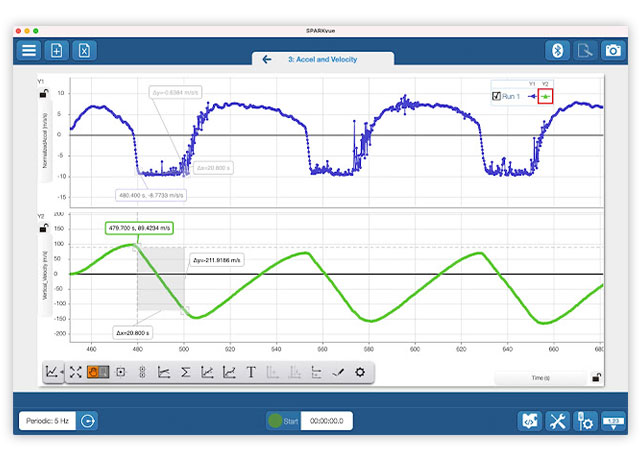
This is counter-intuitive for many people, including Miles O'Brien in the CNN video. It is not surprising because the word "fall" is almost always used to describe something that is heading toward the ground. Eventually, the plane's vertical speed reaches zero, and it starts speeding up on the way down. The 212 m/s change in velocity during the 20.8 s free fall period shown on the graph checks out. Accelerating at 9.81 m/s2 for 20.8 s would cause a 204 m/s change in vertical velocity. If my analysis is correct, then the plane reaches a maximum downward speed of 147 m/s (327 mph!) after the first parabola on the graph. We were falling with style. I like to imagine the shock of students coming up with this value in class as they realize their teacher was hurtling toward the ground at 327 mph. It shocked me when I first calculated it.
Zero-g Physiology
For my last experiment, I became the test subject. Could I survive 30 parabolas without getting motion sickness? Curvy mountain roads, roller coasters, and spinning amusement park rides have never bothered me. I was always the one on the whale watching boat who’d take advantage of the free snacks while others were feeding the fish with their breakfast. When I worked at Lockheed, I had a colleague who taught aerobatic plane flying. One day he was bragging that he could make anybody sick. I said I didn't think he could make me sick. We bet the price of the plane rental and met at the airport. He tried everything in the book – inside and outside loops, barrel rolls, Immelmanns, hammerheads – nothing got me sick. He acknowledged I won the bet and said I could pilot a loop if I wanted. I declined, claiming my back was sore, which was true, but secretly I knew I might get sick if I did one more maneuver.
As I aged, I noticed my cast-iron stomach was getting a little rusty. I could ride the roller coasters with physics students on Physics Day at the amusement park but would need time to recover before the next ride.
I did not want to get sick in zero-g. Getting sick on the ground is unpleasant, but at least you know where the vomit is going. Deb suggested that I skip taking anti-nausea medicine if I hadn’t needed it in the past. That made sense, but Deb is unusually tolerant of zero-g. So, I sought out a rookie. I met author Mary Roach at our NCNAAPT meeting. She had flown the NASA KC-135 while conducting research for her book, Packing for Mars. She used the NASA-recommended scopolamine patch and had no problems. Mary did say that I should do whatever the Zero-G people recommended, so I stuck with Deb's advice and took nothing. Deb advised that if I should change my mind, the medicine needed to be taken long before takeoff. There was one AE participant who did not heed Deb’s advice. She borrowed my water bottle to wash down some Dramamine on the plane, just before we started doing parabolas. She was very sick after the first free fall parabola and spent the rest of the flight suffering in a seat in the back.
Marsh gave us some specific advice for avoiding motion sickness: lie on your back between free falls and stare at a spot on the ceiling, take it easy for the first 5-6 zero-g parabolas, and avoid doing spins and flips unless you feel exceptionally good. If you must do a spin or flip, wait until the last parabola. Overall, I felt pretty good except during the 1 g turnarounds. The only time free fall bothered me was when I was focusing on adjusting the signal generator frequency and keeping the Kundt's tube working. I chose to not do any spins or flips until the end. When they announced, "last parabola" I was feeling okay and decided to do a spin, moving my arms in and out like a figure skater. I didn't get much of a speed increase, but I was happy to do a spin and hoped the cameraman got a good shot. You can see below that he did!
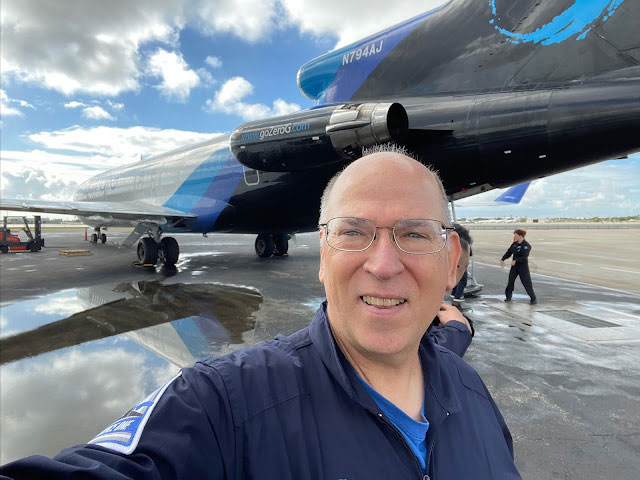
The plane pulled up and began our 1-g cruise back to the Fort Lauderdale airport. As I was lying on the floor putting away the signal generator, I suddenly became nauseous. It was time I learned the value of my sick bag. As I walked back to the seats, I saw that about one-third of the researchers were holding sick bags. I am sure they had a much more challenging set of tasks than I did. The ride back was a little turbulent and there are no windows in G-Force Once. I focused on the front bulkhead and survived. By the time we’d landed, I was thrilled to get off the plane, as seen in my post-flight selfie below.
After this incredible experience, I can only hope to fly on the Zero-G plane again. I would especially like to fly with a group of teachers who are doing some of my experiments. Maybe next time we can stick with the 15-parabola flight. Thanks to PASCO, Zero-G, and Deb Houts for giving me this unbelievable experience.
File Attachments
| Zero-G Data | File Size: 2.43 MB |